jViz.RNA 4.0
jViz.Rna 4.0 is the newest extension of jViz.RNA.
A multi-platform visualization tool inspired by feedback from
life sciences experts, jViz.RNA 4.0 provides faster and
better RNA visualizations for all RNA classes.
RNA structures can be explored, manipulated, and edited
to fit the needs of any user. Any of the produced visualizations
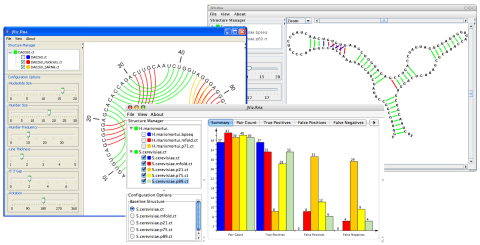
can be saved as an image format to enable easy usage
in publications and presentations.
Features
Multi-platform capability
jViz.RNA 4.0 is built using Java 1.6, enabling usage on Linux, Mac OS X, and Windows.
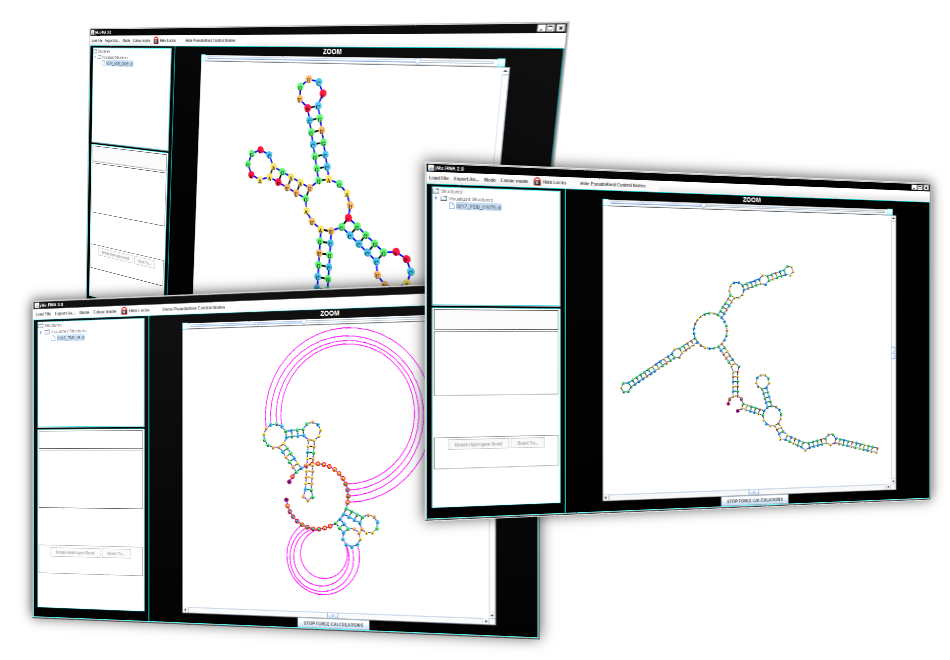
Pseudoknot Visualization
jViz.RNA 4.0 is capable of visualization of all biologically available pseudoknots.
Faster Dynamic Visualization
Using state-of-the-art integration systems, jViz.RNA provides a dynamic structure which quickly responds to user manipulation. This software will provide an automatic layout which users can then edit to fit their needs.
Online Editing
Structures can be edited by removing or adding base-pairs into the structure, allowing users to create related RNA structures with ease, or create an entirely new RNA structure using only the RNA sequence
Structure Management
Load as many structures as you'd like and jViz.RNA will allow you to switch between them quickly as you explore their similarities and differences.